I recently saw an article in NZ Herald about a race between 4 people using different transportation modes (car, bus, bicycle, and train) to travel from New Lynn into the city. Google Maps can provide an estimation of travel time for all these modes but the experiment showed the actual travel time can be different. The final result showed travel time by car took much longer than estimated, travel time by bus and train took longer but with much lesser margin, and the travel time by bicycle was much shorter than estimation.
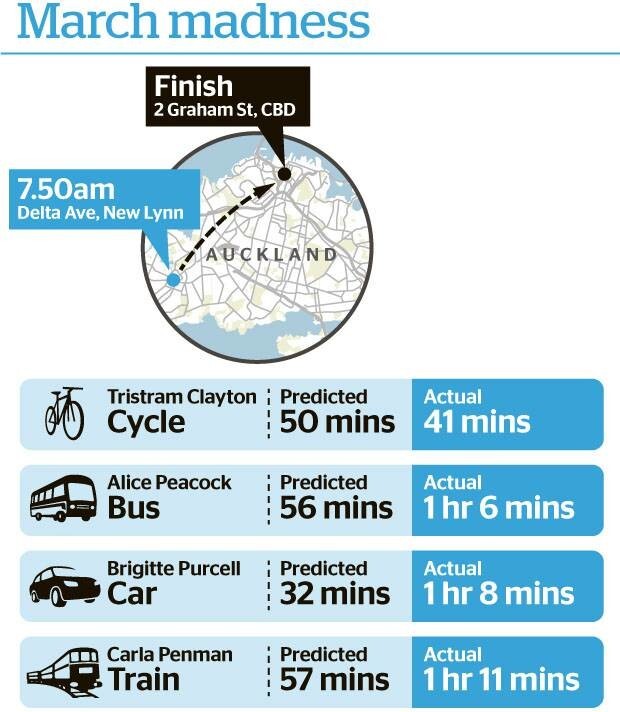
I know can’t statistically rely on this experiment but I used these results anyway to find out which mode can beat the March Madness all over Auckland. Here is what I did:
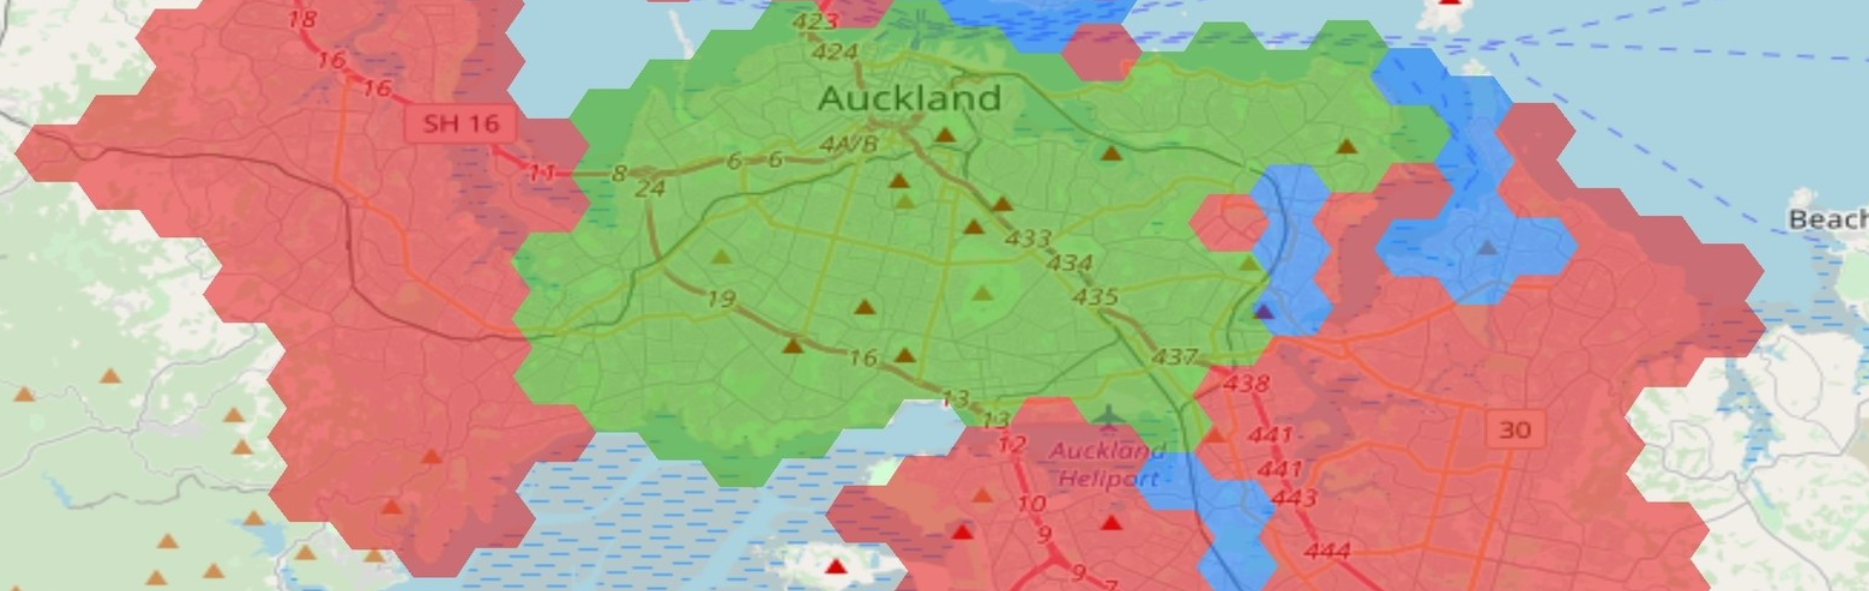
First, I divided Auckland’s metropolitan area into 2 sqkm hexagon zones (Hex). Second, I measured the estimated travel time between the centroid of each Hex and Graham Street in the City Centre. Graham Street is the same destination used for NZ Herald’s experiment. I used Google Maps to measure this travel time by driving, transit, and cycling. Third, I calculated the ratio between Google’s estimates and actual travel time in NZ Herald’s experiment for each mode. Forth, I multiplied the estimated travel times between Hex centroids and City centre to these ratios. Finally, I mapped the fastest mode for each Hex (below).
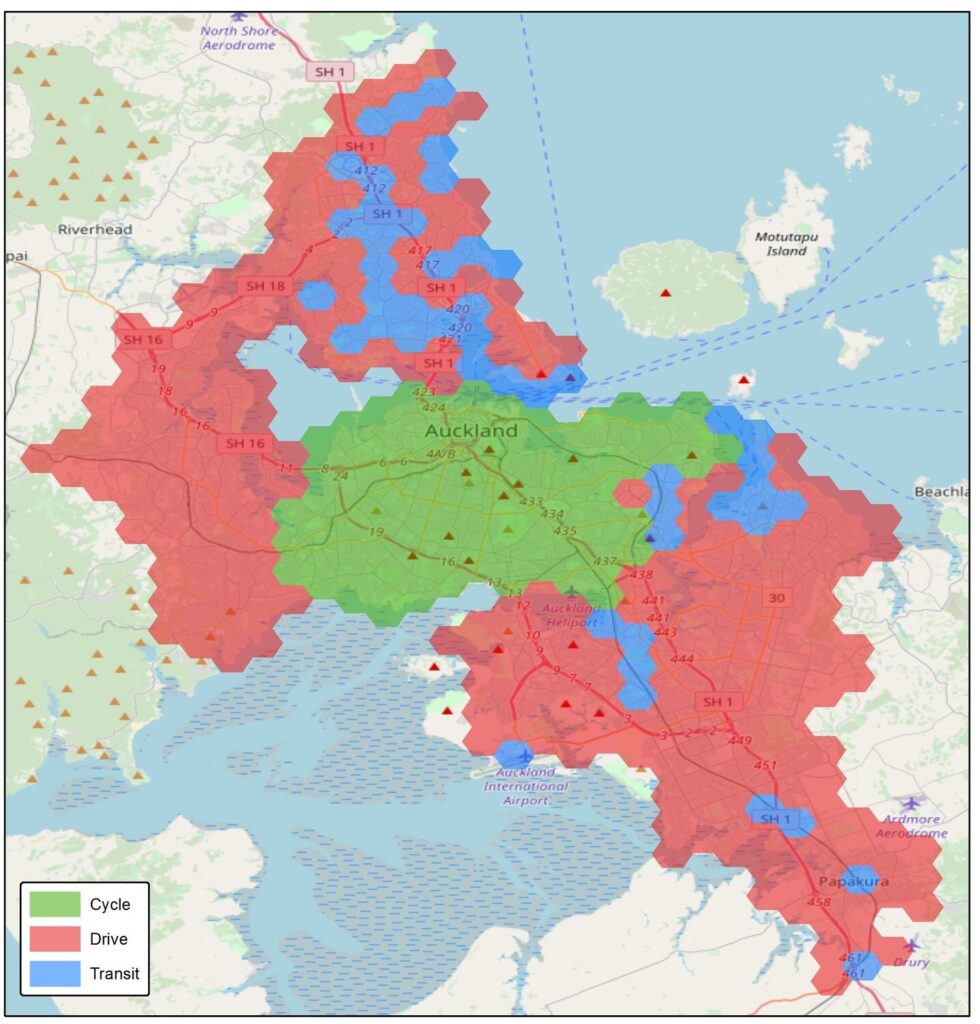
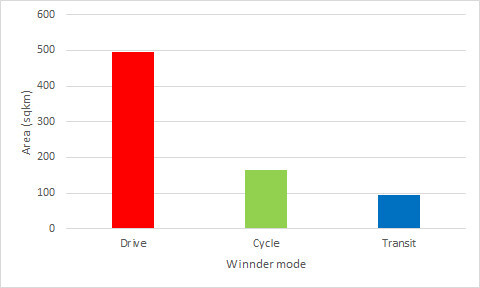
The good news is, cycling can take you anywhere within the Isthmus faster than any other mode. The bad news is, the public transportation performs poorly here. The area with better public transport is almost a fifth of the car area and a half of the bicycle area.