Introduction
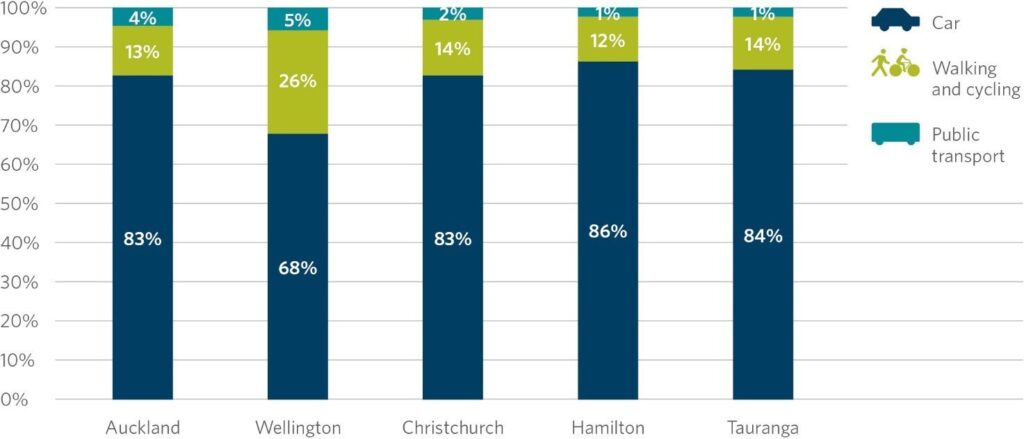
Aucklanders are heavily reliant on their cars to meet their travel needs with more than 80% of daily trips being made by cars. However, the high socio-economic costs of private cars such as congestion, poor quality urban environments, pollution and carbon emissions, poor public health and high travel costs to name a few, have raised interest in alternative transportation planning such as Public Transportation (PT). The main objective of the new approach to transportation planning is to increase the share of travel by PT which is also called “Mode Shift”.
Mode shift can improve the wellbeing of Aucklanders by shaping a more accessible, safe and sustainable transport system. In order to achieve mode shift, it is necessary for PT to generate “comparative advantage” over cars to encourage people to switch. The comparative advantage can take various forms such as costs, capacity, time, flexibility, reliability or accessibility. While a combination of all these factors can influence decisions made by individuals to shift to PT, providing accessibility seems to be more fundamental. If PT doesn’t take you where you want to go and when you want to go, it technically does not exist for you.
The accessibility is a combination of faster travel time and more mixed land-use patterns. From a more classical point of view, accessibility can be understood as the ease of reaching desired destinations given a number of available opportunities and intrinsic impedance to the resources used to travel from the origin to the destination. Usually, opportunities are measured in terms of employment positions, and impedance in units of distance or time (Hansen, 1959; Dalvi, 1978; Handy and Niemeier, 1997). PT accessibility, by linking to places and people, indicates the ability and freedom of choice (Talen, 2001).
While accessibility crucial role in mode shift, the literature about how this measure can be implemented in mode shift plans is limited. It is not clear how accessibility can be used to identify the comparative advantage of the PT mode to inform planning and policy decisions. The main objective of this research is to address this gap by proposing a universal and robust method. The next section of this paper is the methodology, followed by the results, a discussion of the findings and a conclusion.
Method
Mode shift in Auckland
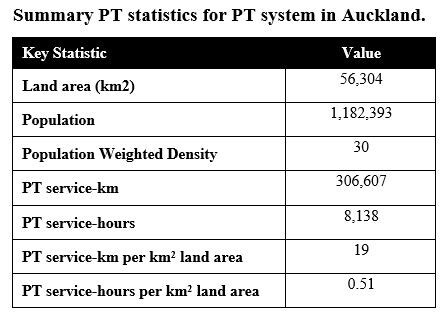
Auckland is the economic hear of New Zealand with growing pollution which is now surpassing 1.7 million. With limited opportunities to increase road capacity in current urban areas, mode shift has become inevitable over the next decade. However, with a legacy of under-investment in PT infrastructure in the last 50 years and a limited budget for new PT improvement, smart investments have become more important than ever.
Data
The analysis makes use of several sources of data on existing transport networks and population and employment locations:
- Open Street Map (OSM) data provides an open database of street networks in the chosen cities. OSM data has been used to model walking network geometry (e.g. street segments, walkways, stairs and their restrictions).
- General PT Feed Specification (GTFS) data models travel times and distances on public transport networks. A GTFS feed comprises a series of text files, where each file models one particular aspect of the PT system, e.g., stops, routes, trips, and schedules (for full description see Google, 2015). This study uses GTFS data valid for Thursday 30 Jan 2019.
- Population and employment data has been sourced from Statistics New Zealand (census 2013) is used at the meshblock (MB) level. A meshblock is the smallest geographic unit for which Statistics New Zealand collects statistical data. Meshblocks vary in size, from part of a city block to large areas of rural land. Area units are slightly larger – in urban areas they generally cover part of a suburb.
- Driving in Traffic data comes from TomTom database. Launched in 2008, TomTom’s historical traffic database makes it possible to obtain detailed information such as travel times, average speeds and probe counts on each segment of a defined road or area at any given time of the day and any day of the year, enabling advanced traffic modelling and analysis.
Measuring comparative accessibility
This research uses the cumulative opportunity, or potential, approach for measuring accessibility and sums the number of jobs reachable within certain times by PT. The figure below shows the catchments at 8:00 for each transportation mode for a random location in the isthmus area in Auckland. The break time is 45 minutes for PT and 30 minutes for cars. The 15 minutes extra time for PT is to compensate for the additional time require in driving to park the car and walk to the designation. In order to calculate the accessibility for Auckland, the number of jobs in each catchment has to be calculated for the centroid of each meshblock.

Once accessibilities are measure PT accessibility divided by car accessibility can show the comparative accessibility. For example, if a mechblock has access 25891 jobs by driving and 50479 jobs by PT, the comparative accessibility of the PT will be 51% which means PT is capable of providing 51% of car accessibility for that particular meshblock.
Results and discussion
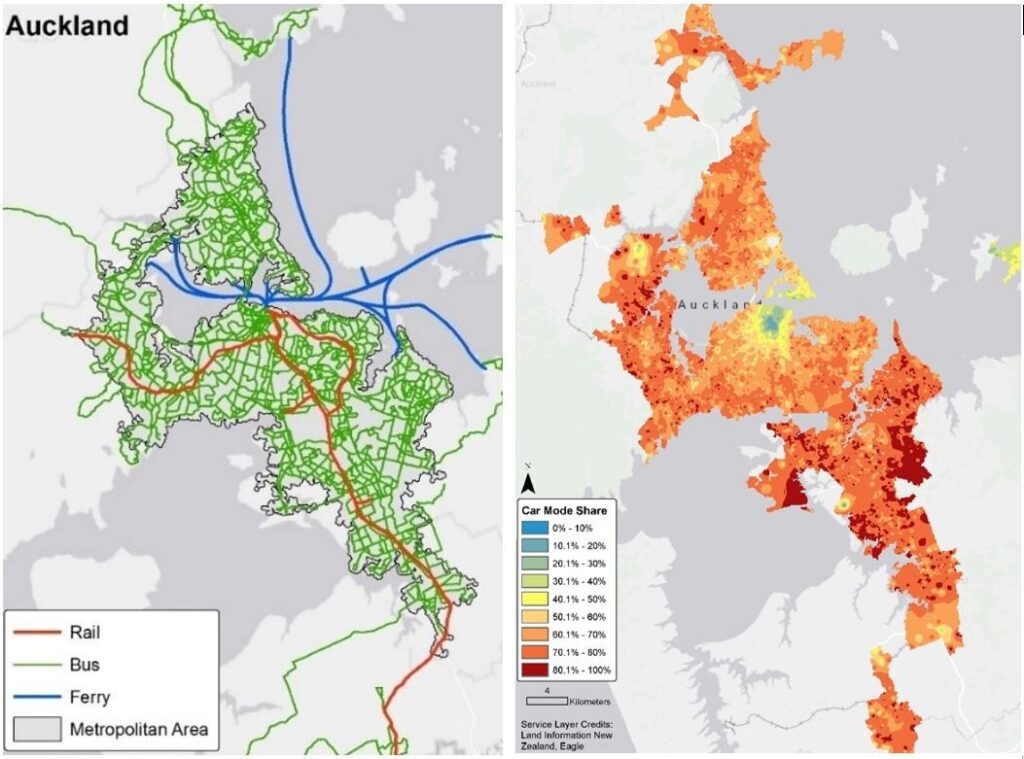
As discussed accessibility is one of the main comparative advantages of PT services. The results in Auckland show PT in its best, provide about half of the car accessibility which is not so great. Said that the areas with high comparative PT accessibility are still good candidates for investment for mode shift because they have a better chance to attract people who usually drive.

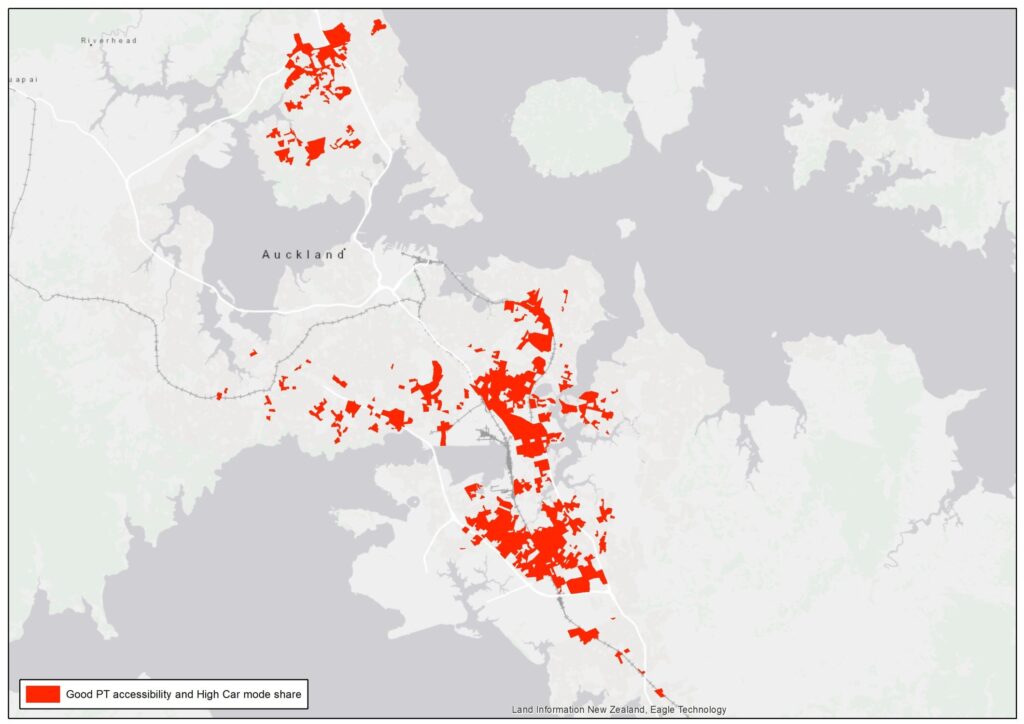
To further narrow this down, it is possible to select areas with high comparative accessibility which have high car mode share. The areas shown in red have a statistically meaningful (95% confidence level) high relative accessibility and high car mode share. These red areas can be a good place to start questioning why people are driving instead of using cars. It is expected these areas have the potential to provide the best value for money for investment in PT mode shift.
Conclusion
If the objective in investment in PT is to achieve the highest Mod Shift, the first candidates are areas with the highest car mode share. In the case of Auckland, these areas are too vast and need further narrowing down. The second candidates are the areas with the highest relative PT to car accessibility. This analysis can narrow down the targets but still, they are too big for an investment plan. The final filter to further narrow the priority investment areas are areas with high relative PT accessibility and high car mode share. Using statistical confidence levels such as 90%, 95% or 99% the investment priority areas can be further narrowed down.
______________________________________________________________________
If you found this article useful or of value, then please do hit the ‘like’ button and share via Twitter, LinkedIn, Google+ and Facebook. It would be great to hear your thoughts, so please ask questions or add your comments and stories to this post.