• Home
  • About
  • Projects
  • Our People
  • Blog
  • Contact us

Latest from the blog

  • I simulated 1.6 million Aucklanders to see what a congestion charge would really do
  • From Data to Decisions: Building an Agent-Based Transport Model for Wellington
  • Cycle ways in Auckland and New Zealand
  • Download Wellington Synthetic Population data
  • The Economic Impact of Wellington’s Tunnel Project

Archives

  • November 2026
  • October 2025
  • July 2025
  • May 2025
  • May 2024
  • June 2023
  • January 2023
  • December 2022
  • November 2022
  • October 2021
  • April 2021
  • September 2020
  • October 2019
  • February 2019
  • March 2018
  • January 2018
  • September 2017

Categories

  • Comment
  • Data visualisation, maps and graphs
  • Journal Paper
  • Land Use
  • Public Transport
  • Python
  • research
  • Social Justice
  • transport model
  • Uncategorized
  • Working Paper

Phone: 0223443551 Email: saeid.adli@spatialeconomics.co.nz

Skip to content
Spatial Economics
  • Home
  • About
  • Projects
  • Our People
  • Blog
  • Contact us

Month: November 2026

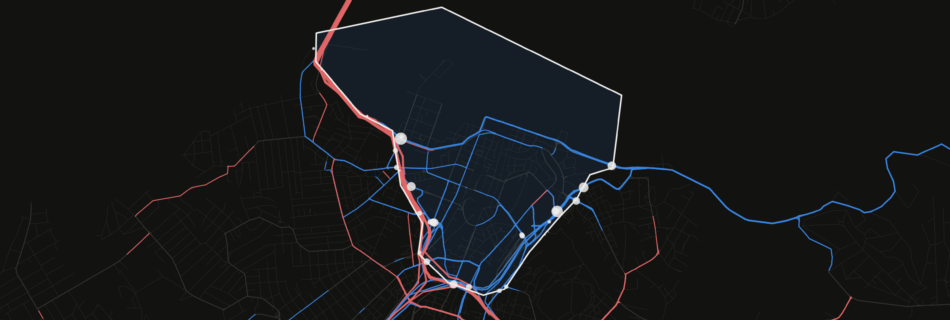
Dark map of central Auckland: roads carrying fewer cars with the charge in blue, more cars in red, around the outlined city-centre cordon.

I simulated 1.6 million Aucklanders to see what a congestion charge would really do

by saeidadliData visualisation, maps and graphs, Public Transport, transport modelPosted on November 18, 2026No Comments

What happens when Auckland charges cars to enter the city centre? A full-population MATSim simulation of 1.6 million Aucklanders finds one in six fewer cars cross into the centre, public transport trips into the centre rise 3%, and some traffic diverts to the motorways around it.

Copyright © 2026 Spatial Economics Inspiro Theme by WPZOOM
Scroll to top