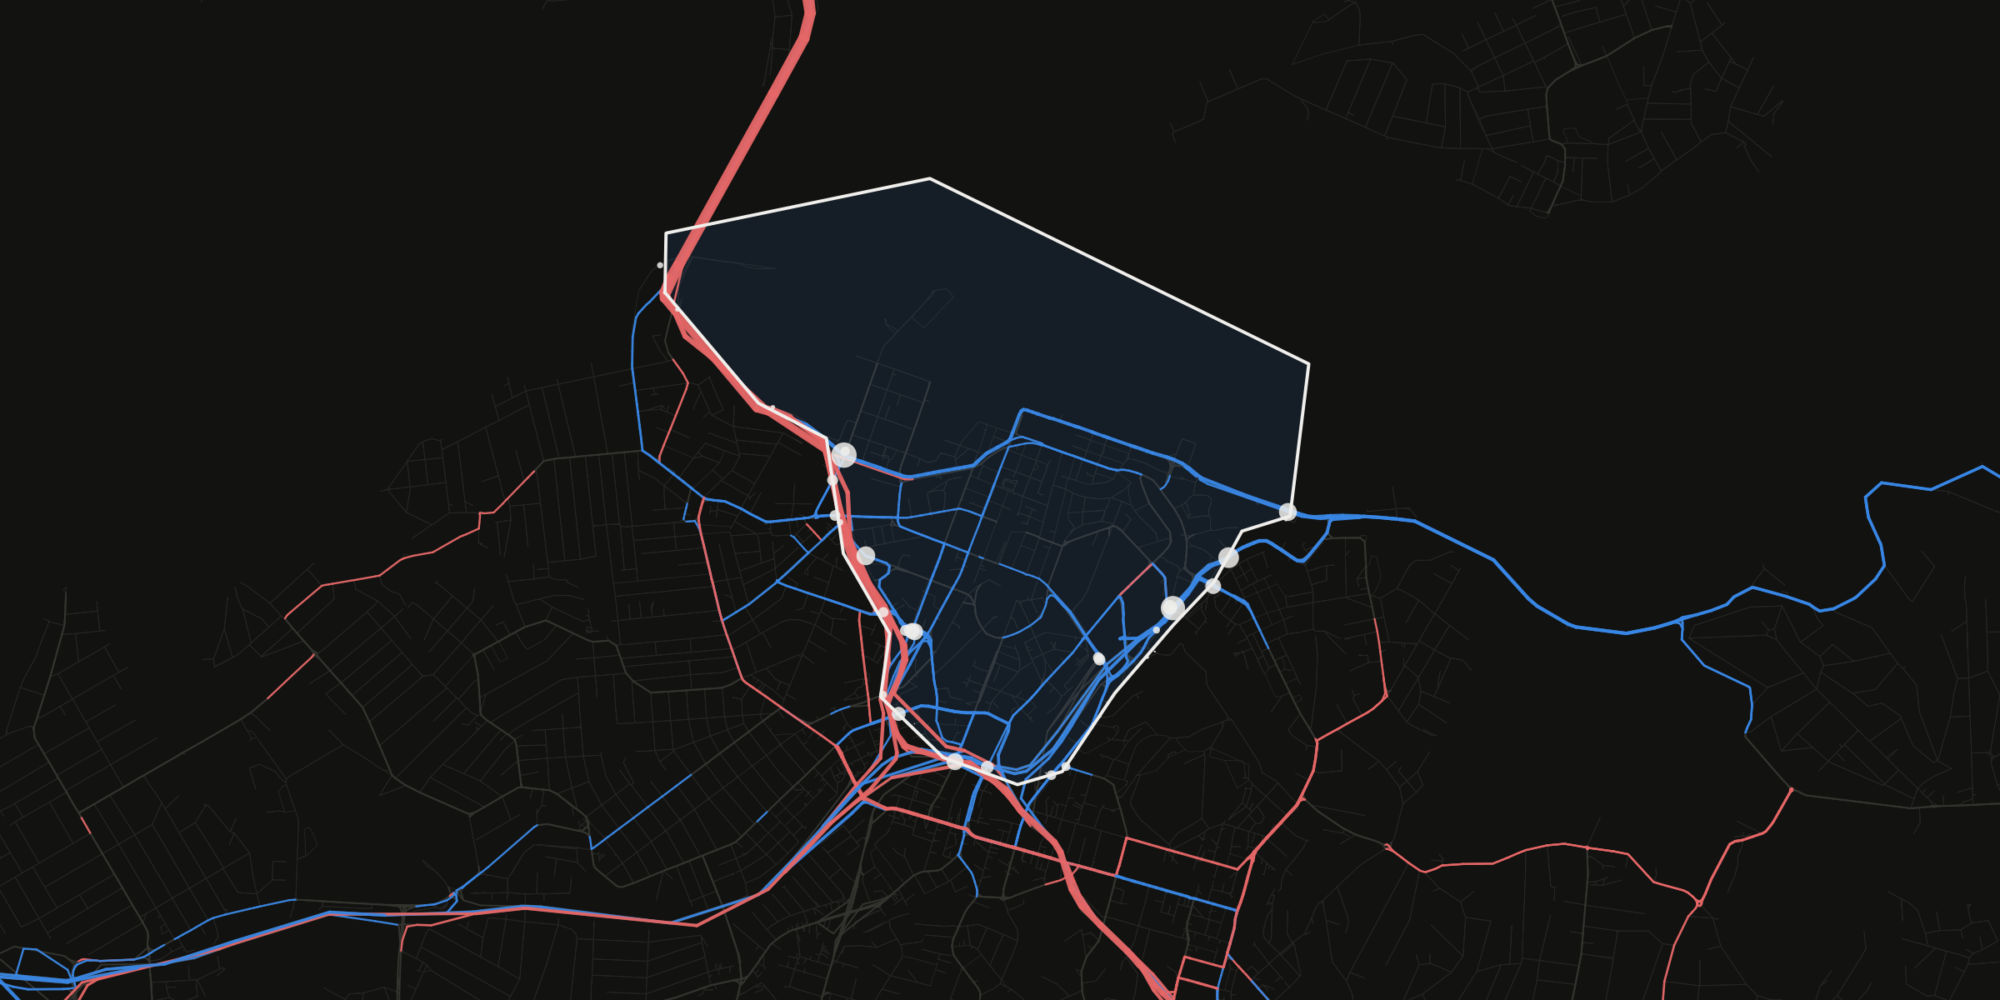
Auckland is talking about congestion charging again, and this time it’s serious. Auckland Council’s consultation on time-of-use charging is open until 11 December 2026. Three options are on the table: a city-centre cordon, a wider city-fringe cordon, and a city centre plus core motorways option. With congestion estimated to cost the region $2.6 billion a year, the stakes are real.
Much of the debate runs on intuition: “it’ll just push traffic elsewhere”, “people have no alternative”, “it’s a revenue grab”. Those are testable claims, so I tested one.
Using MATSim, an open-source agent-based transport simulator, I built a virtual Auckland and ran it twice: once as it is, and once with a charge to drive into the city centre. Same people, same day, same random seed. The only thing that changed was the price.
Here’s what happened.
A virtual Auckland, one person at a time
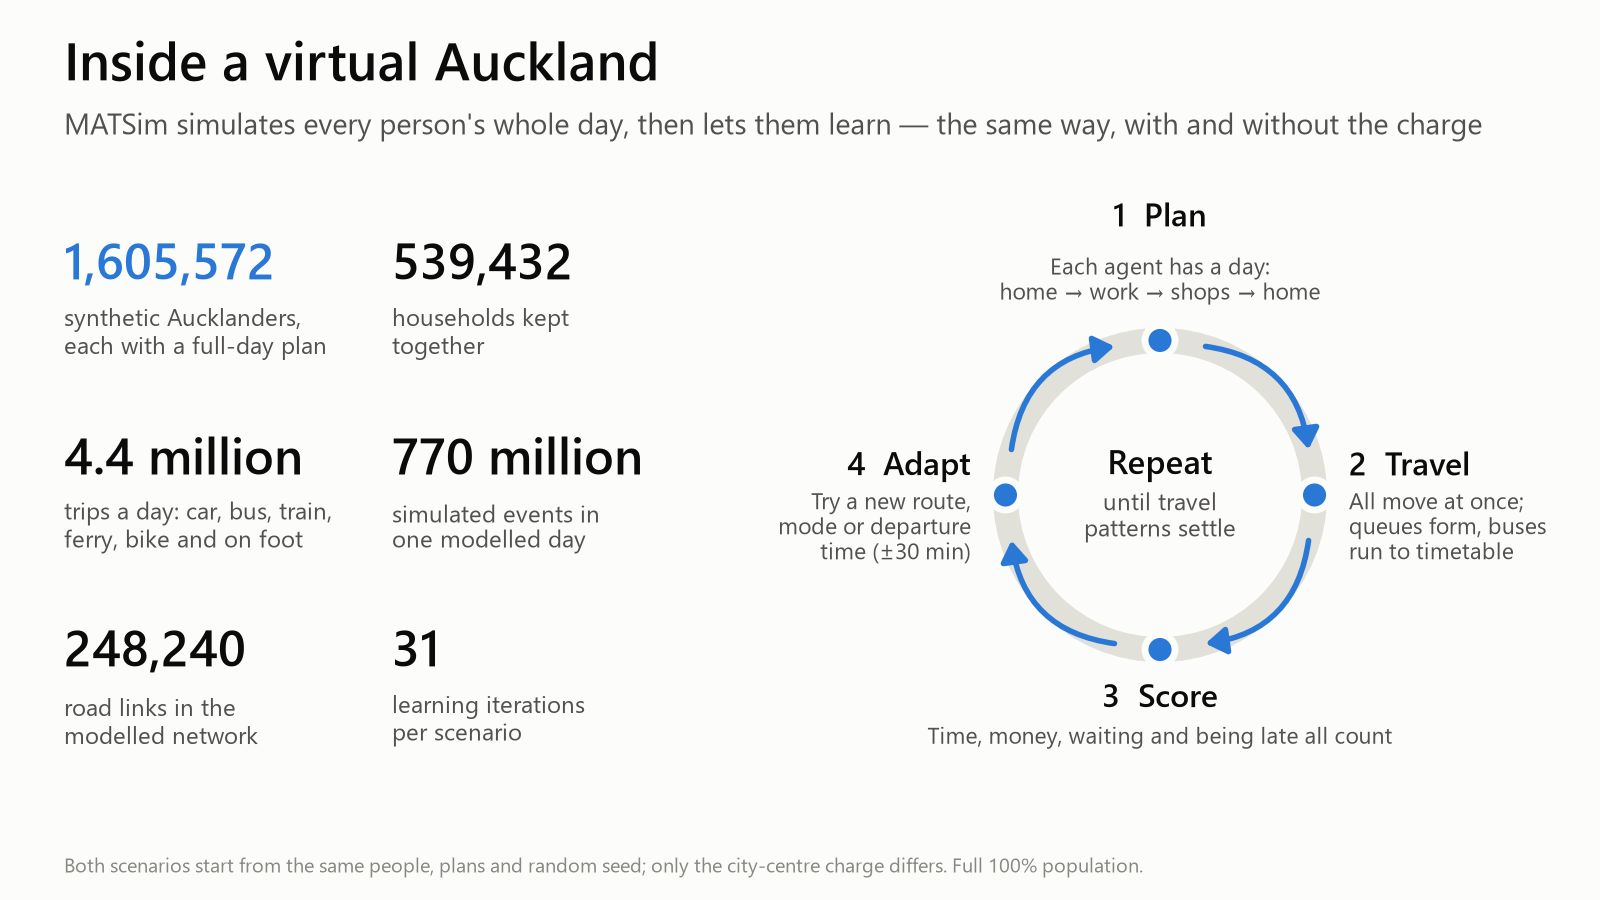
Traditional models work with zones and averages. MATSim works with people. Each of 1,605,572 synthetic Aucklanders, living in 539,432 households, has a full day: leave home, drop the kids at school, go to work, pick up groceries, come home.
All of them travel at once on a detailed road and public transport network. Roads fill up and queues spill back, while buses, trains and ferries run to their timetables. At the end of each simulated day, every person’s day is scored on travel time, money spent, waiting, and arriving late. Then some of them try something different (a new route, a different mode, or leaving up to 30 minutes earlier or later), and the day runs again. After 31 rounds of this learning, travel patterns settle down.
One modelled day produces about 770 million events: every car entering every road link, every passenger boarding every bus. That level of detail is what lets you follow how individual people respond to a price.
The scheme I tested
I modelled a city-centre cordon that is close in spirit to Council’s Option A (City Centre Cordon):
- Every car crossing into the city centre pays at one of 49 entry points.
- $6 in the peaks (7–9am and 4–6pm), $4 in the shoulders either side, $2 for the rest of the day between 6am and 7pm, and free overnight.
- Public transport and cycling are exempt, and motorway through-traffic isn’t charged.
It isn’t Council’s scheme. Theirs charges inbound trips in the morning peak and outbound trips in the evening peak, and the prices are still open (the modelled range is $2–$7). But it’s close enough to ask the right questions.
1. One in six fewer cars cross into the city centre
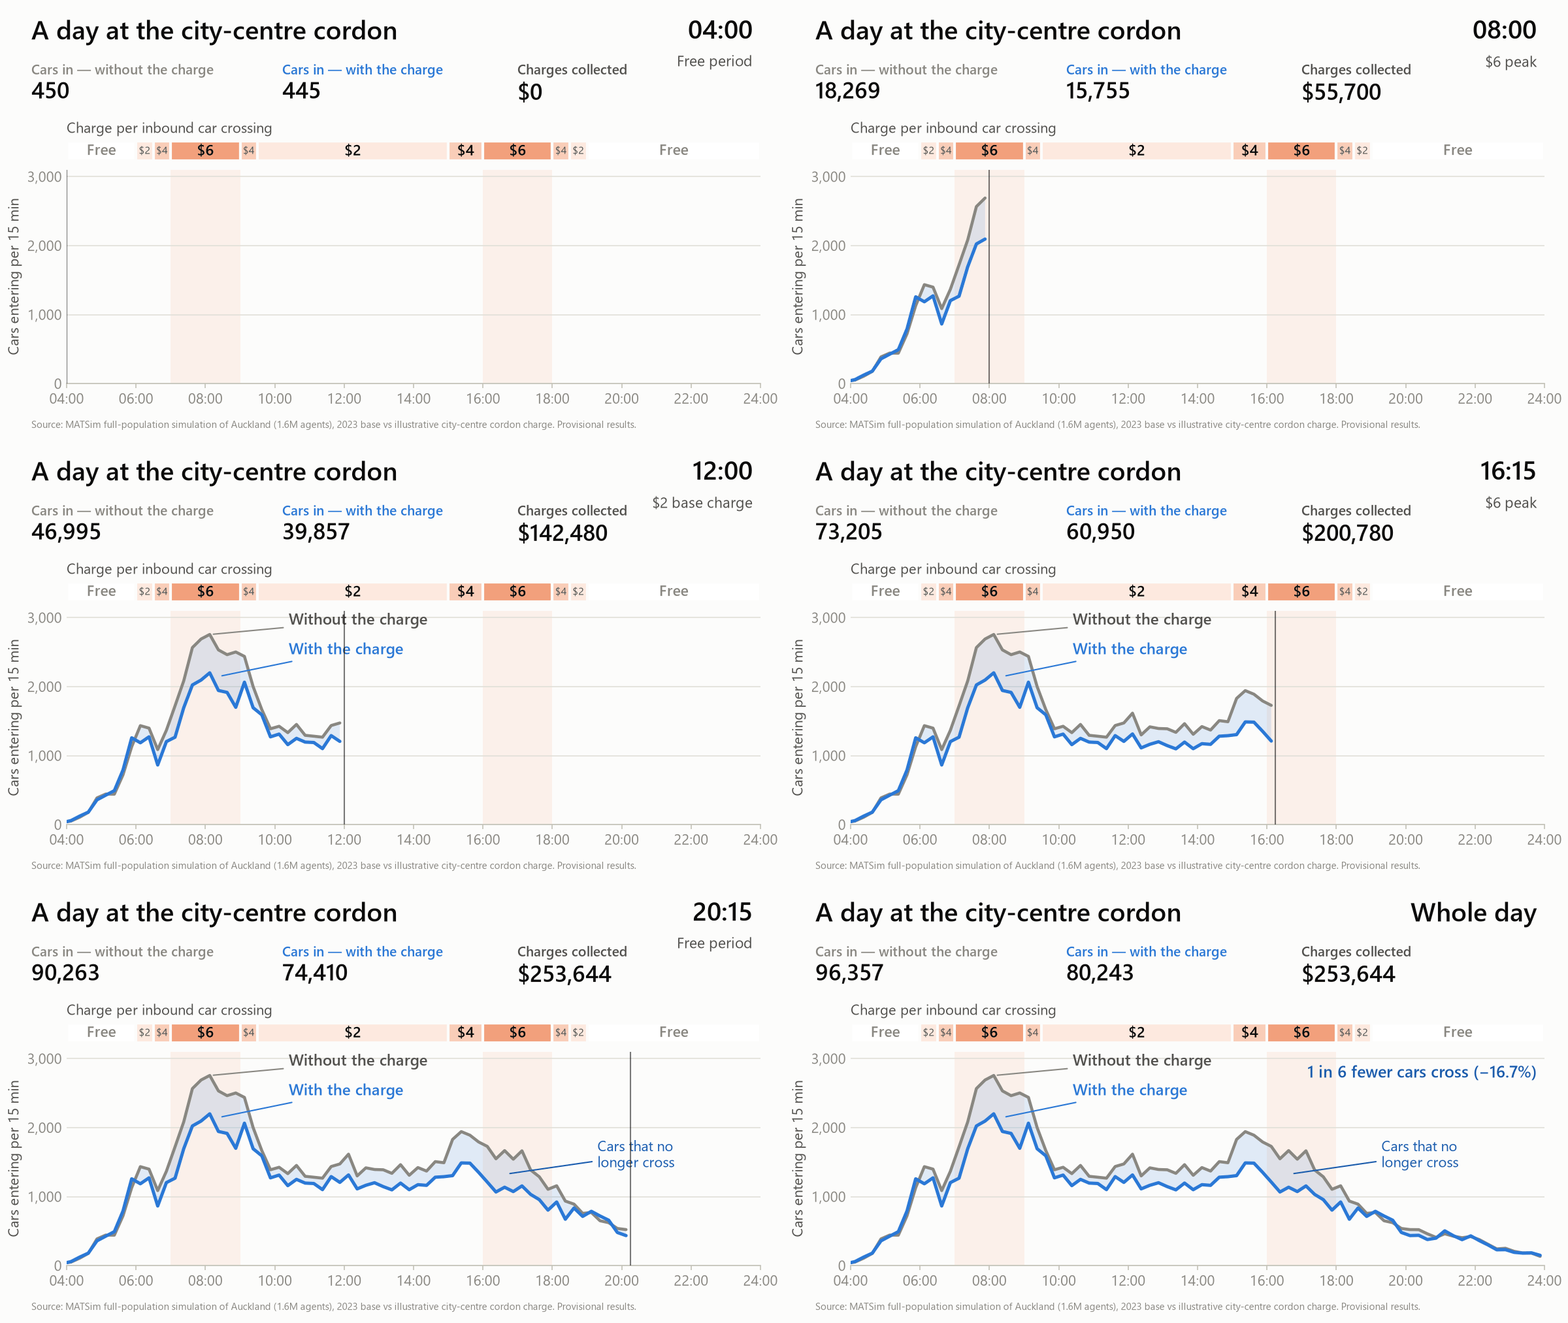
Without a charge, about 96,400 cars cross into the city centre on a modelled weekday. With the charge it’s 80,200, a drop of 16.7%, or roughly 16,100 fewer car entries a day.
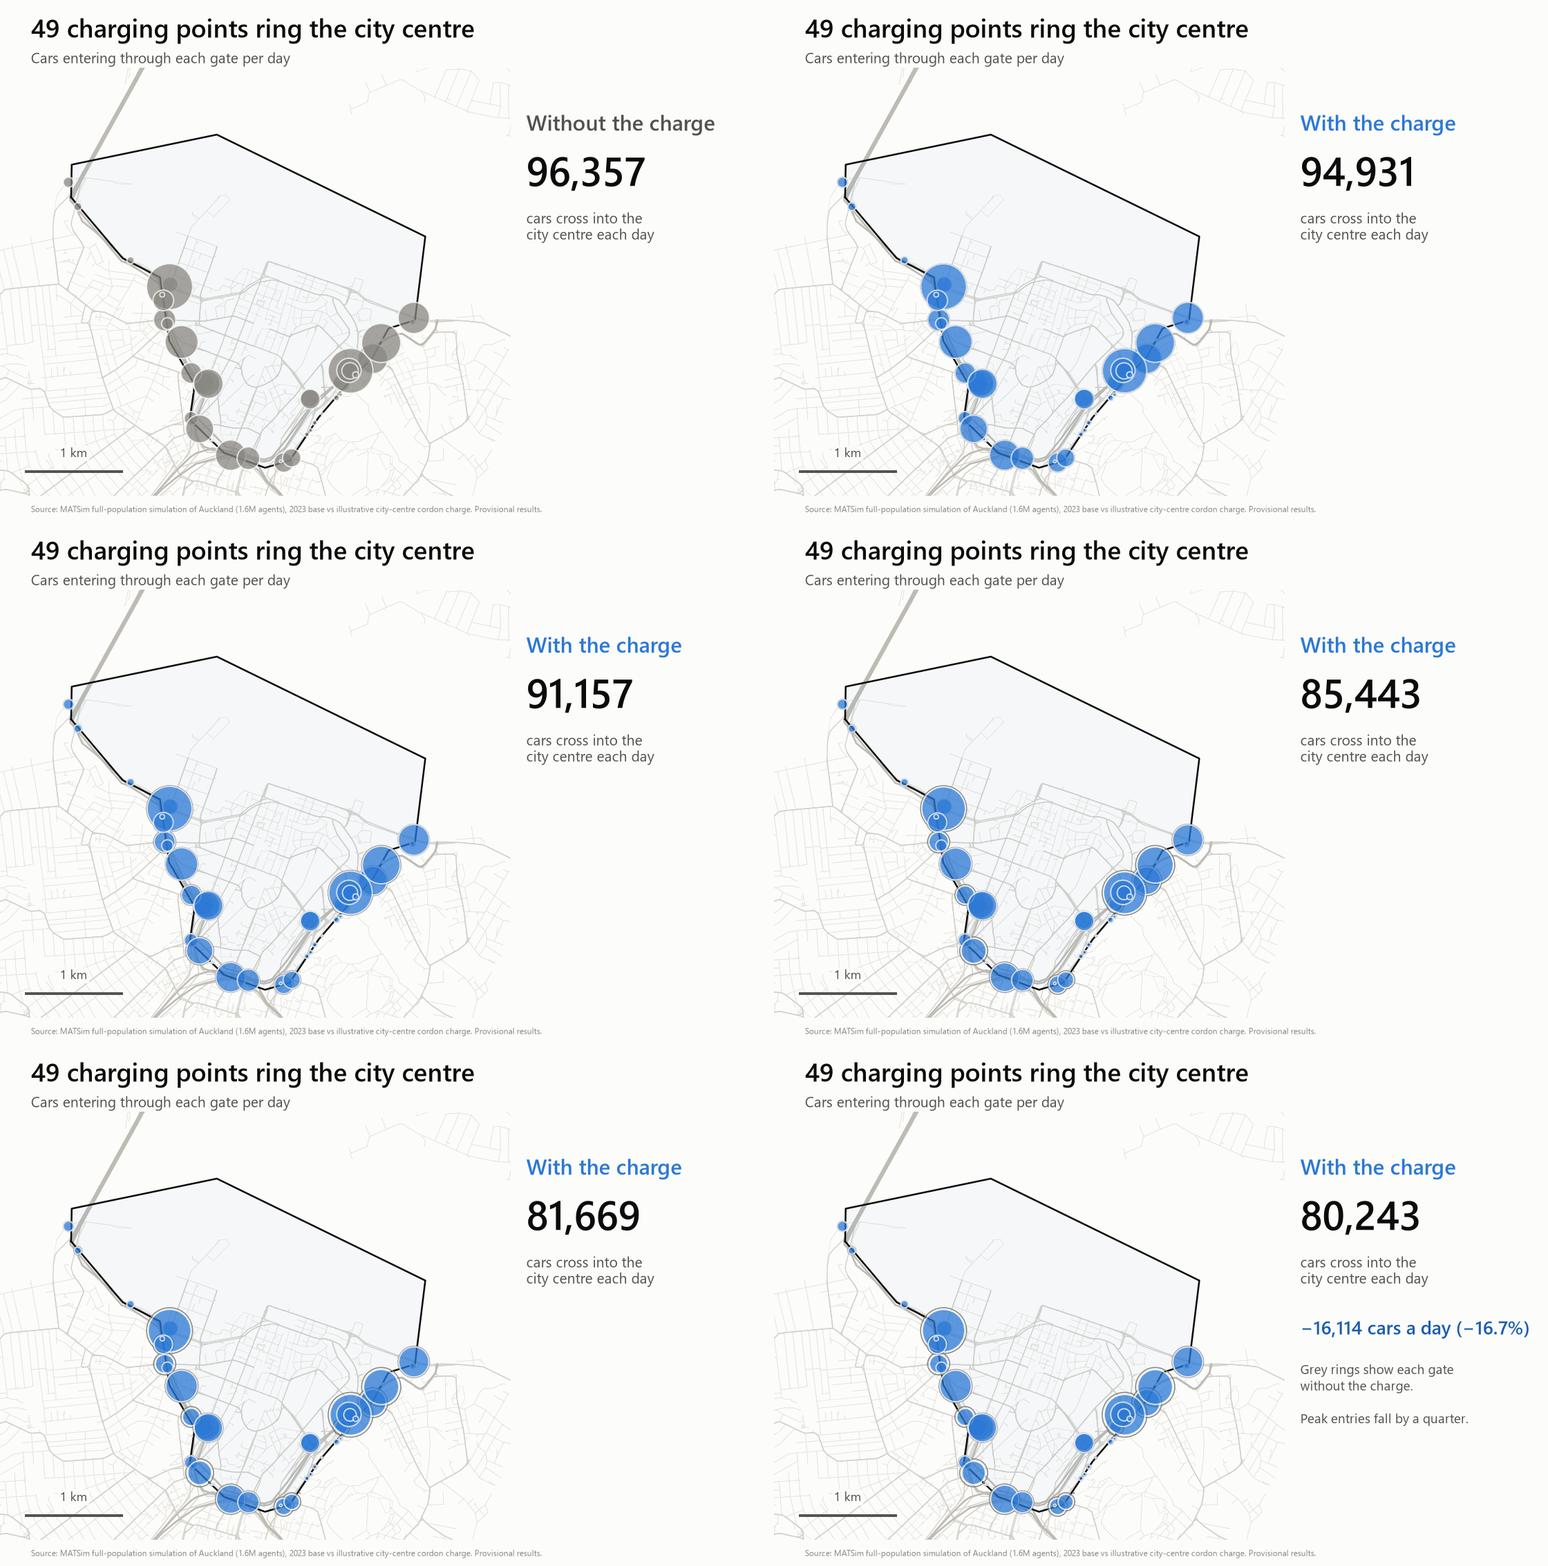
2. People respond to the price, not just the existence of a charge
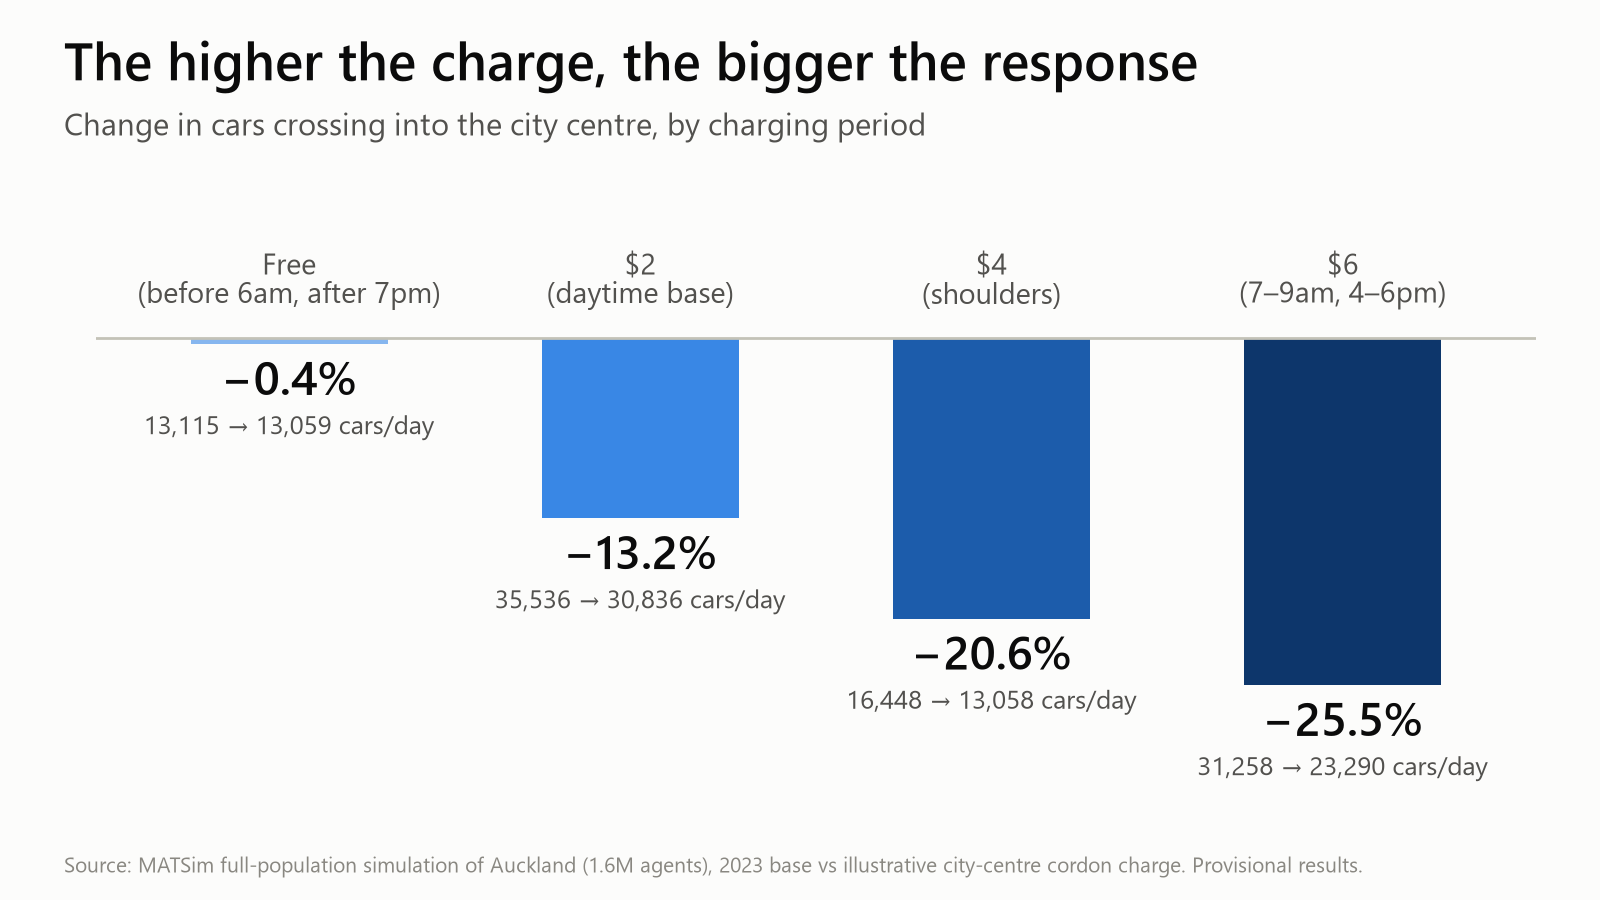
This is my favourite result. Entries fall by 25% in the $6 peaks, 21% at $4 and 13% at $2, and barely move when crossing is free. Nobody told the model to behave this way. The pattern emerges from 1.6 million agents weighing time against money. It’s also a reminder that the price ladder is a design lever, not a detail.
What didn’t happen is just as interesting: there was no rush into the free hours. Free-period entries were flat (−0.4%). In this model, people mostly changed how they travelled and which way they drove, not when. Agents could only shift their departure by up to 30 minutes, so that is partly a modelling assumption. Real-world flexibility may be greater.
3. Where did the drivers go?
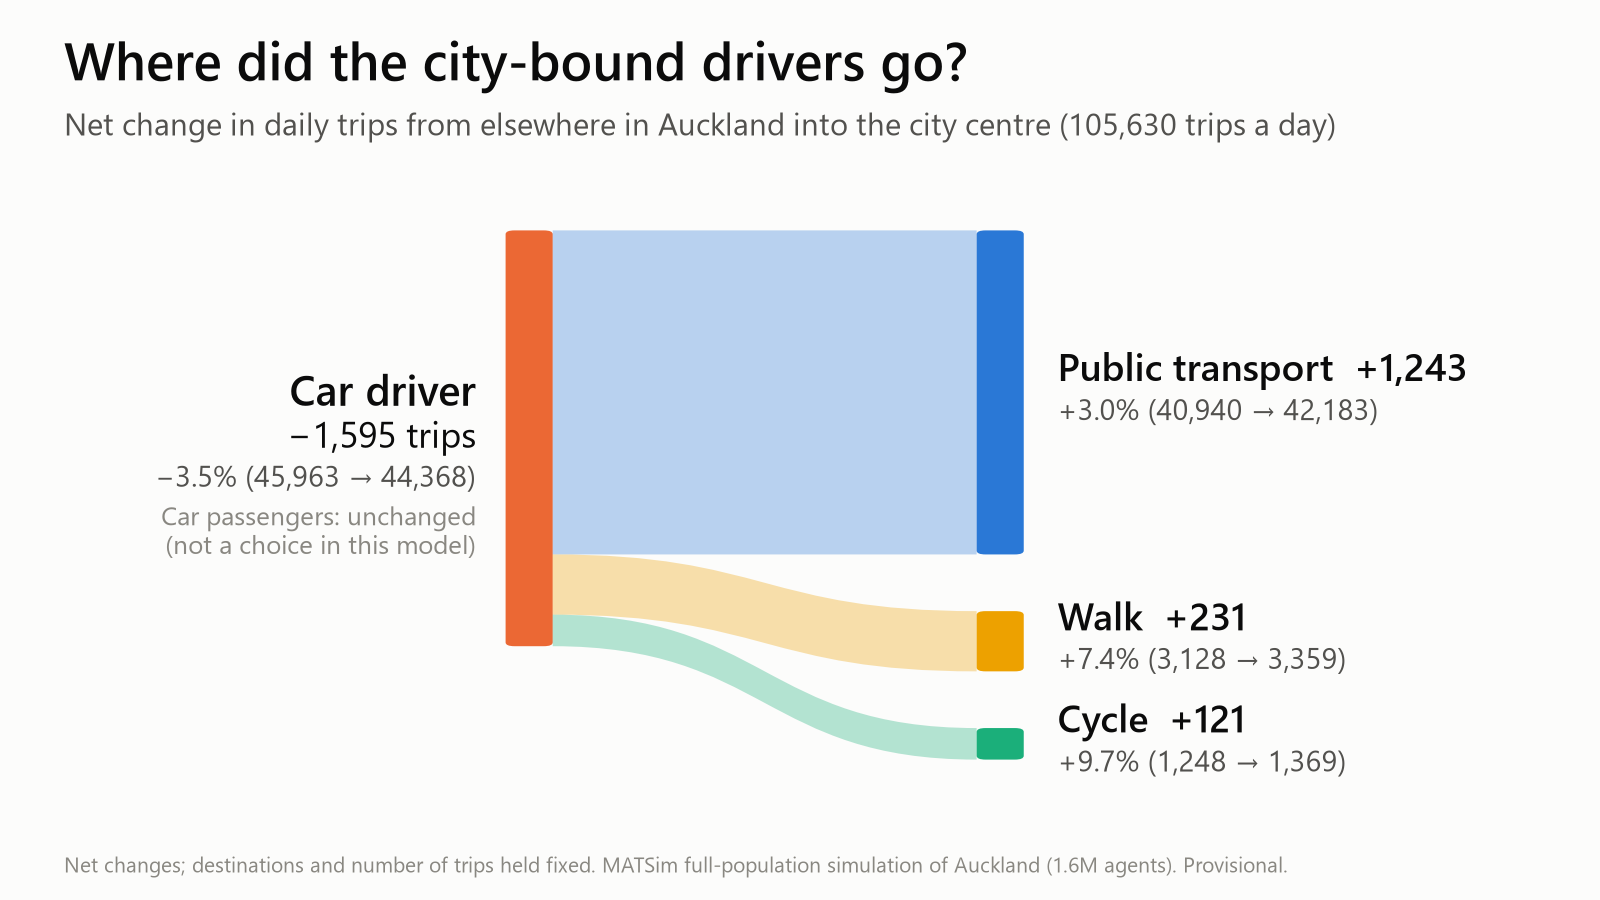
Take the 105,630 daily trips from the rest of Auckland into the city centre. Car-driver trips fall by 1,595 (−3.5%). Most of those people, 1,243 of them, switch to public transport (+3.0%). Walking rises 7.4% and cycling 9.7%, from small bases.
Council’s own modelling of its cordon option points to about 3% more morning-peak public transport use. Different model, different measure, same ballpark, which is reassuring.
Put another way: of the 57,344 people who drove into the city centre during charged hours without the scheme, about 3 in 10 no longer crossed the cordon by car at all once the charge applied. They switched mode or found a route that avoids it. Some of that is the model’s own churn (see the fine print below), but the direction is clear.
4. Traffic doesn’t vanish. Some of it goes around
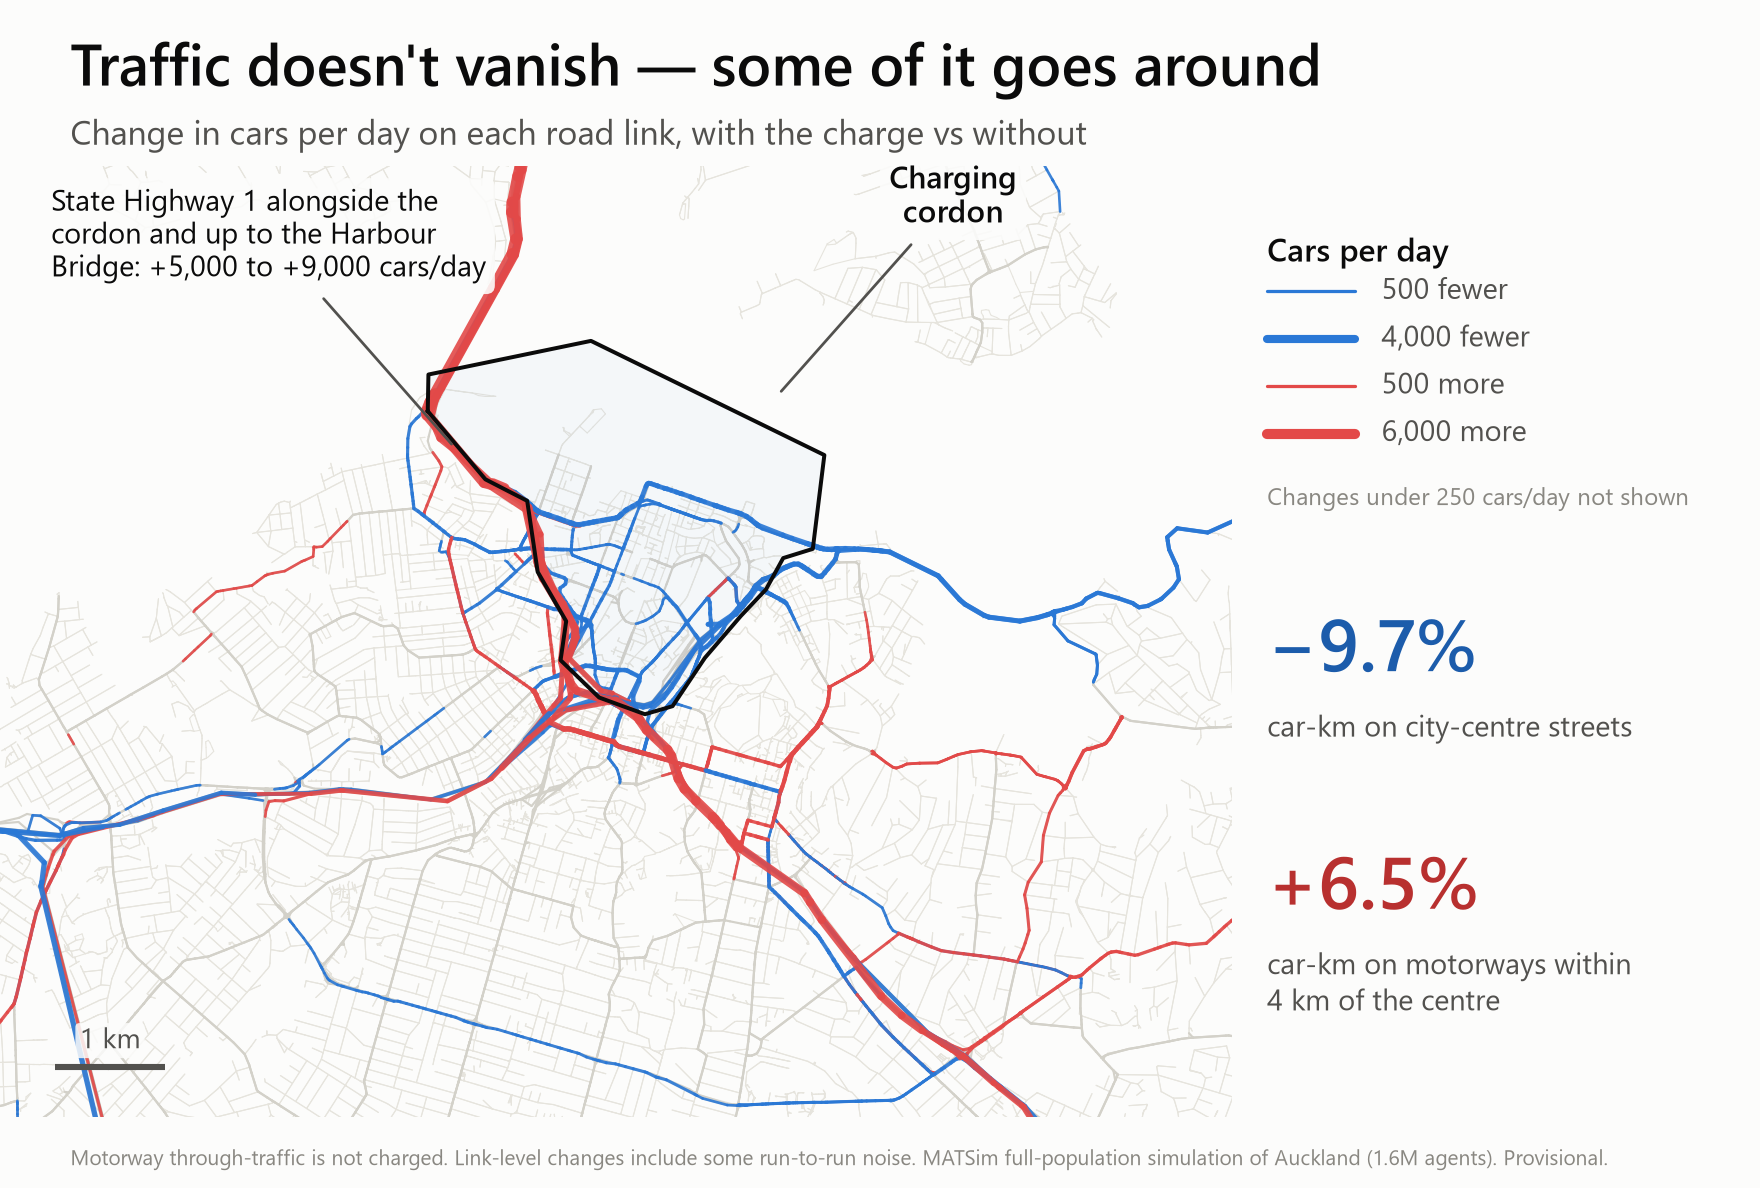
This is the finding I’d most want decision-makers to see. Car-kilometres on city-centre streets fall 9.7%. But the motorways within 4 km of the centre carry 6.5% more, with State Highway 1 alongside the cordon and up to the Harbour Bridge picking up roughly 5,000–9,000 extra vehicles a day.
That isn’t a reason to abandon a cordon. Some of those drivers used to cut through city streets because it was quicker; now they stay on the motorway, which is what motorways are for. But it does mean the motorway network around the centre, already one of Auckland’s most congested stretches of road, has to be part of the design. That is also the logic behind Council’s Option C, which adds charging on the core motorway sections.
5. A scalpel, not a sledgehammer
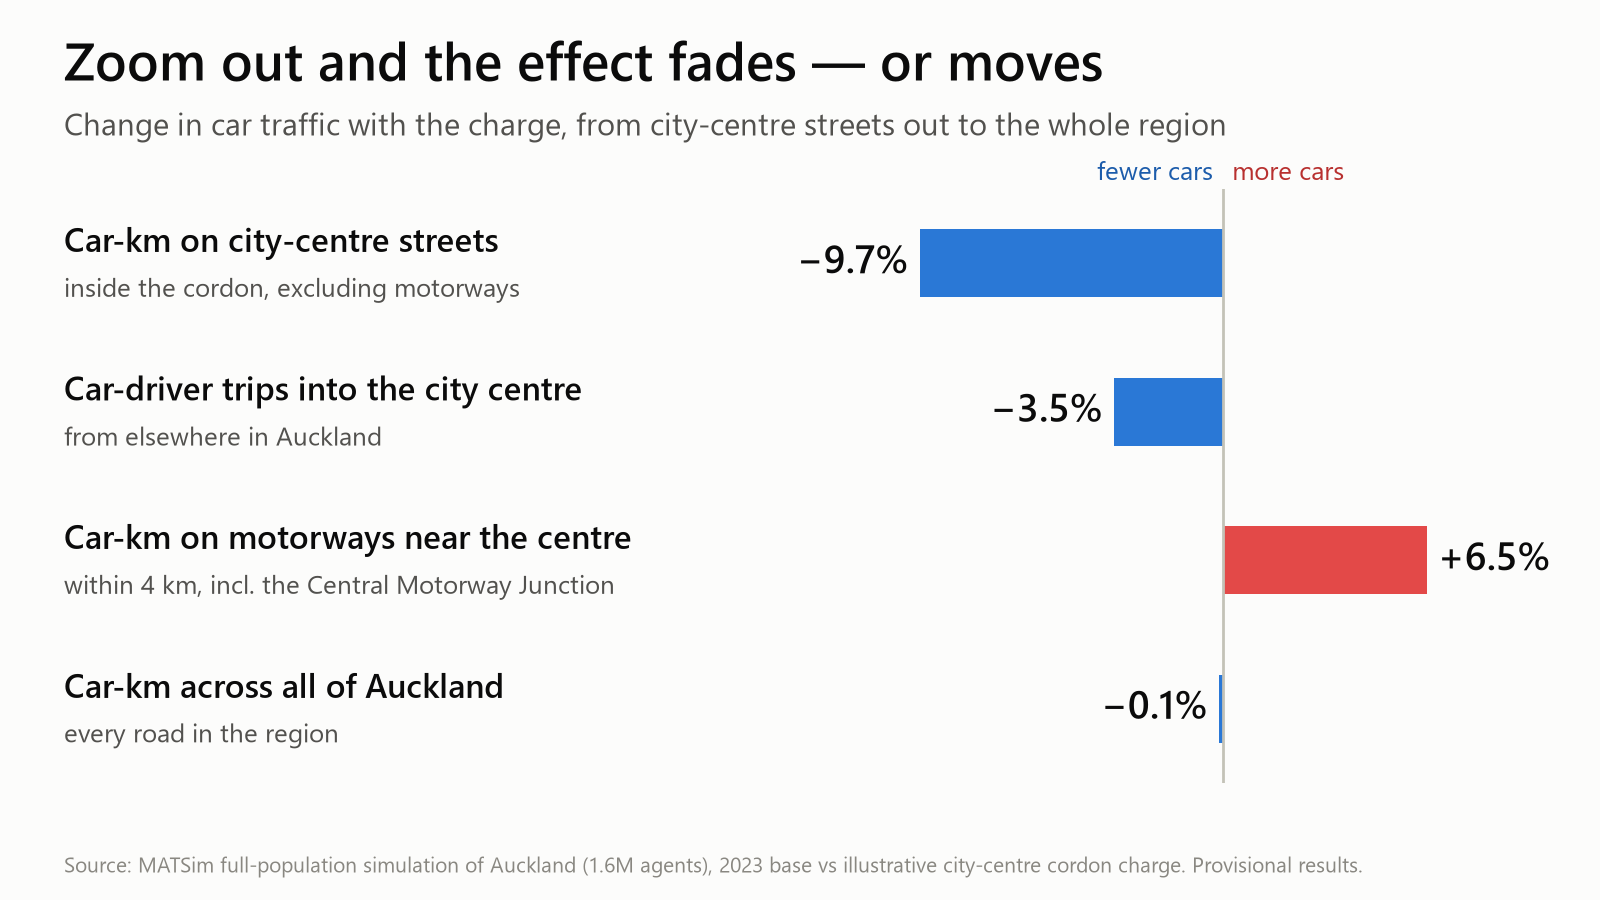
Zoom out to the whole region and the effect almost disappears. Total car-kilometres across Auckland fall by just 0.1%, and the share of all trips made by car barely moves. That isn’t a failure. Only about 1 in 18 of Auckland’s 4.4 million daily trips starts or ends in the city centre. A city-centre cordon is a precise tool for a specific problem. It won’t fix congestion in Albany or Manukau, and nobody should sell it as if it will.
What about the money?
The modelled charges come to about $254,000 per weekday, and 55% of that is collected in the two $6 peaks. I’d treat that as a model receipt, not a revenue forecast. The price response hasn’t been calibrated against real-world data, and the model doesn’t include exemptions, caps, enforcement costs or leakage. Council has said the primary purpose is to reduce congestion, with revenue ring-fenced for transport in and around the charged area.
What I’d take from this
- Pricing works on the margin it targets. A graded price produced graded responses, and the peaks moved most.
- Plan for where the traffic goes. The boundary and its interaction with the motorways matter as much as the price.
- Public transport has to be ready. Most people who stopped driving in took the bus, train or ferry instead. That capacity needs to be there on day one.
- Be honest about scale. A cordon reshapes the city centre. It doesn’t reshape Auckland.
The fine print (because it matters)
This is a provisional scenario experiment, not a forecast.
- The price response comes from the model’s behavioural parameters. It hasn’t been calibrated against observed responses to road pricing.
- It’s one random seed. Individual agents churn between runs, so I report net changes and trust the direction more than the decimal place.
- Real people have more options, so the real response could be larger.
These are exactly the things I’d refine next. They’re also why I’d always pair a model like this with real-world evidence from Stockholm, London and Singapore.
For the modellers
- MATSim, 2023 Auckland base, full 100% population (1,605,572 agents in 539,432 households) at full road capacity.
- Two matched runs from the same selected plans and seed. 31 iterations (innovation to 24, selection-only 25–30) with 2 retained plans.
- Route, subtour mode (car / PT / bike / walk, respecting licence and car availability) and ±30-minute departure-time innovation.
- Time-of-day toll on 49 inbound gate links, charged at actual link-entry time. Every toll payment is reconciled independently against the event file.
- About 770 million events per run, post-processed in Python (pandas and GeoPandas).
- Gross switching is much bigger than the net: about 9,200 city-bound trips went car → PT and 7,800 went PT → car. Anyone reporting agent-based pricing results should show net alongside gross.
- MATSim’s stuck-vehicle events, a rough gridlock signal, fell 12% network-wide.
Have your say
If you’re working on road pricing, accessibility or transport appraisal, in Auckland or elsewhere, I’d love to compare notes, so get in touch. What would you test next: a wider fringe cordon, motorway charging, or a different price ladder?
Related on this site: The equity implications of Auckland Transport’s road pricing scheme (2024) and From data to decisions: building an agent-based transport model for Wellington (2025).