Introduction
Access to green spaces is essential for the well-being and quality of life of urban residents. They provide opportunities for recreation, relaxation, and connection with nature, offering numerous physical and mental health benefits. In this blog post, I present a geospatial analysis that aims to evaluate the availability of green spaces within a 15-minute walking catchment for SA1s in New Zealand. The analysis utilized open data sources and open-source tools, focusing on the DOC Public Conservation Land and Reserve Land datasets provided by the Department of Conservation.
Background
Numerous studies have highlighted the benefits of urban green spaces on human health and well-being. Access to green spaces has been linked to reduced stress levels, improved mental health, increased physical activity, and enhanced social cohesion within communities. For instance, a study conducted in Auckland by Richardson, Mitchell, and Pearce (2010) demonstrated that exposure to green spaces was associated with decreased mental distress and improved psychological well-being among residents.
To ensure equitable access to green spaces, it is crucial to understand the spatial distribution of these spaces within urban areas. Geospatial analysis, such as the one presented in this blog post, offers a valuable approach to assess green space accessibility and inform urban planning decisions. By analyzing the proximity of green spaces to residential areas, researchers and policymakers can identify areas with inadequate access and prioritize interventions to address any inequities.
Previous studies have utilized geospatial techniques to investigate green space accessibility in various urban contexts. For example, a study by van Herzele and Wiedemann (2003) examined the distribution of green spaces and their accessibility by different socio-demographic groups in Brussels, Belgium. Their findings revealed disparities in access based on income and highlighted the importance of considering social equity in urban green space planning.
In the case of Auckland, the Auckland Council has recognized the significance of green spaces and actively promotes their development and accessibility through initiatives such as the Auckland Plan and the Parks and Open Spaces Strategic Action Plan. These documents provide valuable insights into the city’s goals and strategies for green space provision and accessibility, offering a framework for future research and policy development.
However, it is important to note that assessing green space accessibility is a complex task due to various factors such as land-use patterns, transportation infrastructure, and demographic characteristics. Additionally, the availability and accuracy of data sources can influence the outcomes of such analyses. Therefore, incorporating multiple data sets and employing robust geospatial analysis techniques, as done in this study, contributes to a more comprehensive understanding of green space accessibility.
In conclusion, the literature review emphasizes the significance of green spaces in urban environments and their impact on human health and well-being. Geospatial analysis provides a valuable tool for assessing green space accessibility, identifying potential disparities, and informing urban planning decisions. Despite limitations in data availability and accuracy, studies on green space accessibility contribute to the broader understanding of urban sustainability and the promotion of equitable access to nature within cities.
Methodology
To assess green space accessibility, I employed a geospatial approach that involved the following steps:
- Data Acquisition:
- I downloaded two layers of interest, namely “DOC Public Conservation Land” and “Reserve Land,” from the Department of Conservation website. These layers represent protected green spaces across New Zealand.
- Additionally, I utilized open street map walking network data, which provides information on pedestrian pathways.
- Spatial Intersection:
- I intersected the walking network with the green space polygons to identify points where the walking network and green spaces overlapped. These points were considered potential entrance locations to the green spaces.
- In cases where no intersection occurred, I used the centre of each green space polygon as the entrance point, acknowledging that this approximation may introduce some error.
- Catchment Analysis:
- Utilizing open trip planner, I calculated the 15-minute walking catchment from the centre of each SA1 region, representing the approximate distance an average person can walk in that timeframe.
- The total area of green spaces whose entrance fall within the walking catchment of each SA1 was then computed, providing an indication of the green space availability for residents in those areas.
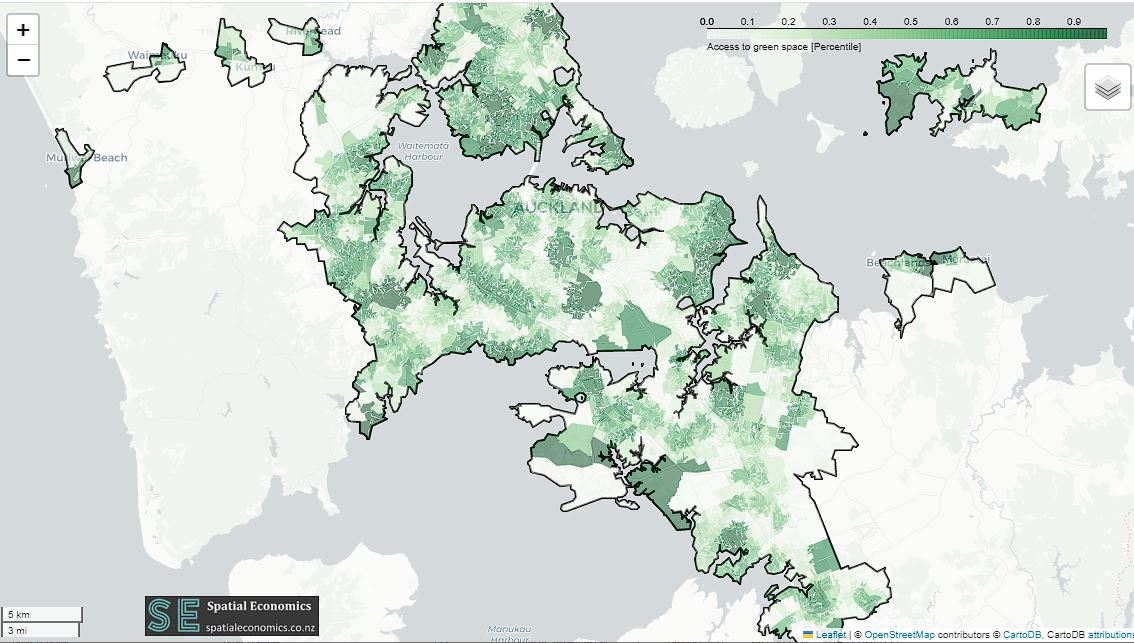
Results
The analysis revealed the distribution of green space accessibility across different SA1 regions in New Zealand. While the precise entrance locations may contain some errors, I believe these discrepancies have a minimal impact on the overall results. The total green space area within the 15-minute walking catchment varied among SA1s, highlighting potential disparities in green space access.
Discussion
The limitations of this analysis should be acknowledged, particularly regarding the accuracy of entrance locations and the scope of available green space data. Some notable parks, such as the “Auckland Botanical Garden,” were absent from the dataset, suggesting the need for additional resources to provide a comprehensive view of all green spaces in New Zealand.
Conclusion
This geospatial analysis provides a valuable assessment of green space accessibility within a 15-minute walking catchment for different SA1 regions in New Zealand. While the results may not be perfect due to limitations in data availability and entrance point accuracy, they offer insights into the distribution and potential disparities in green space access across urban areas. I hope that these findings will inform policymakers, urban planners, and researchers in their efforts to enhance equitable access to green spaces and promote sustainable urban development.
References
Richardson, E. A., Mitchell, R., & Pearce, J. (2010). Shortt, N. K., et al. (2019). Examining the role of greenspace in socio-economic inequalities in physical activity among children and adolescents: A systematic review. International Journal of Behavioral Nutrition and Physical Activity, 16(1), 1-14.
van Herzele, A., & Wiedemann, T. (2003). A monitoring tool for the provision of accessible and attractive urban green spaces. Landscape and Urban Planning, 63(2), 109-126.
Auckland Council. (2023) Auckland Plan 2050. Retrieved from [URL].
Auckland Council. (2013). Parks and Open Spaces Strategic Action Plan. Retrieved from [URL].
Download
You can freely download the results of this geospatial analysis on green space accessibility in New Zealand. The shapefile containing the summarized green space data within the 15-minute walking catchment of each SA1 region can be accessed at [download link].
Entrance points to the green spaces have also been provided as a separate shapefile, allowing for a more detailed exploration of the access points. You can download the shapefile with entrance points at [download link].
Please note that the accuracy of entrance points may vary, and some discrepancies may exist.
Please use the following citation to reference this work:
Adli, S. A. (2023). Assessing Green Space Accessibility in New Zealand: A Geospatial Analysis [Blog post]. Retrieved from [URL].