Introduction
Bus service, especially in busy urban areas, is facing the challenge to enhance its reliability. Studies have revealed that unreliability can seriously undermine the attractiveness of bus service (Lin et al., 2008). Hence, most transit agencies have monitored service reliability as one of the key performance measures for their bus operations (Benn and Barton-Aschman, 1995).
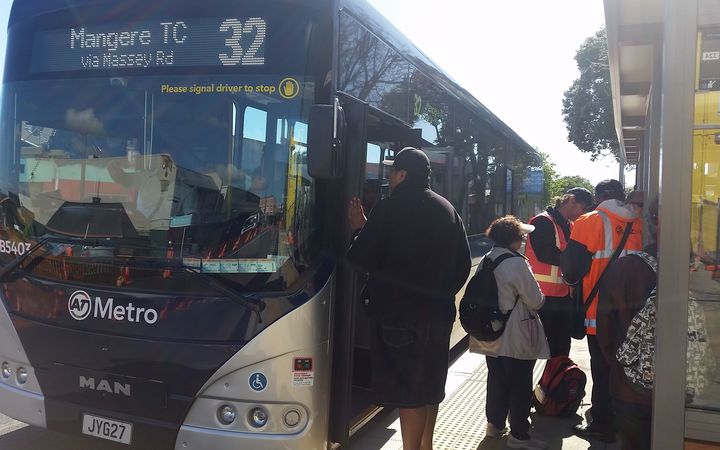
In Auckland, while great improvements have been made over the past 20 years, historic under-investment, combined with rapid population growth, means public transport services still face big challenges. In many cases buses are running in the traffic flow which means PT reliability is affected by congestion and disruption.
In practice, improving service reliability relies on a statistical analysis of the route performance. Thus, PT agencies tend to miss the bigger picture of how delays are spatially scattered in the network. To this end, this paper proposes a spatial analysis method to visualise the spatiality of PT delays and find areas where the least investments return the highest outcome. This information will equip transit agencies with the ability to identify potential service problems at the stop, route, or network level, which ultimately lead to improved PT services.
The next section of this paper explains the research methodology. The results are then presented and it continues with a discussion of the findings. The paper concludes with the importance of the proposed method and its limitations.
Methodology
Study area
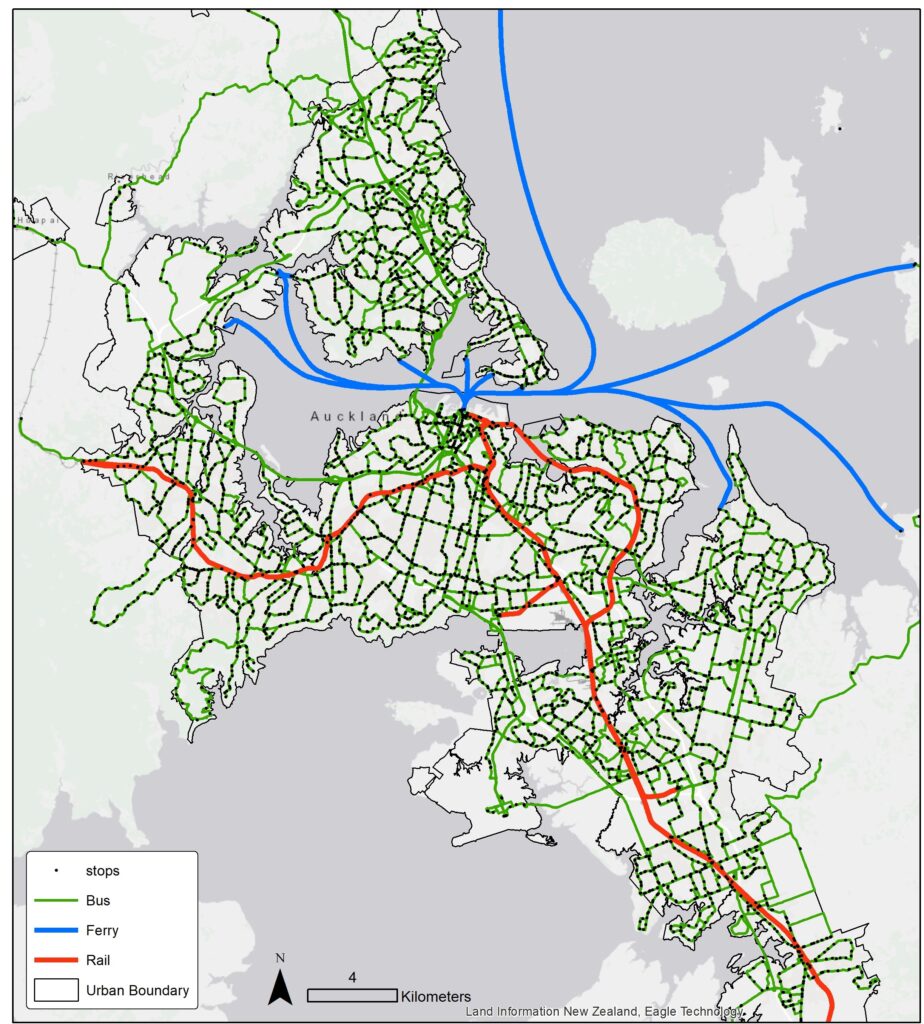
Auckland has substantial transport problems which impose high economic costs on society. A reliable public transport system is therefore not just important to the region, but essential for the whole country. Eighty-five per cent of journeys to work in Auckland are made using private vehicles. As a result, Auckland is renowned for its congestion and the worst levels of public transport provision in a Western city in the developed world (Laird et al., 2001) catering for only seven per cent of all journey to work trips. Auckland has approximately 46.5 million bus boardings’, 7.6 million rail boardings’, and 4.3 million ferry boardings’ each year (Auckland Regional Transport Authority, 2010a). A more reliable public transport system can help more people to shift their mode of transportation to PT. Figure 1 shows the public transport network in Auckland.
Data
This paper makes use of General Transit Feed Specifications (GTFS)and GTFS real-time data. GTFS data is used in this paper to collect stops locations, routes and trips data on public transport networks. A GTFS feed comprises a series of text files, where each file models one particular aspect of the PT system, e.g., stops, routes, trips, and schedules (for full description see Google, 2015).
GTFS Realtime is a feed specification that allows public transportation agencies to provide realtime updates about their fleet to application developers. It is an extension to GTFS (General Transit Feed Specification), an open data format for public transportation schedules and associated geographic information. GTFS Realtime was designed around ease of implementation, good GTFS interoperability and a focus on passenger information.
The data collected in this paper is focused on 6 am to 9 am, Friday 11 Sep 2020.
Analysis
This paper uses spatial analysis tools such as kriging interpolation, raster reclass, and raster conversation tools to spatially map the delay data.
Results and Discussion
Delays
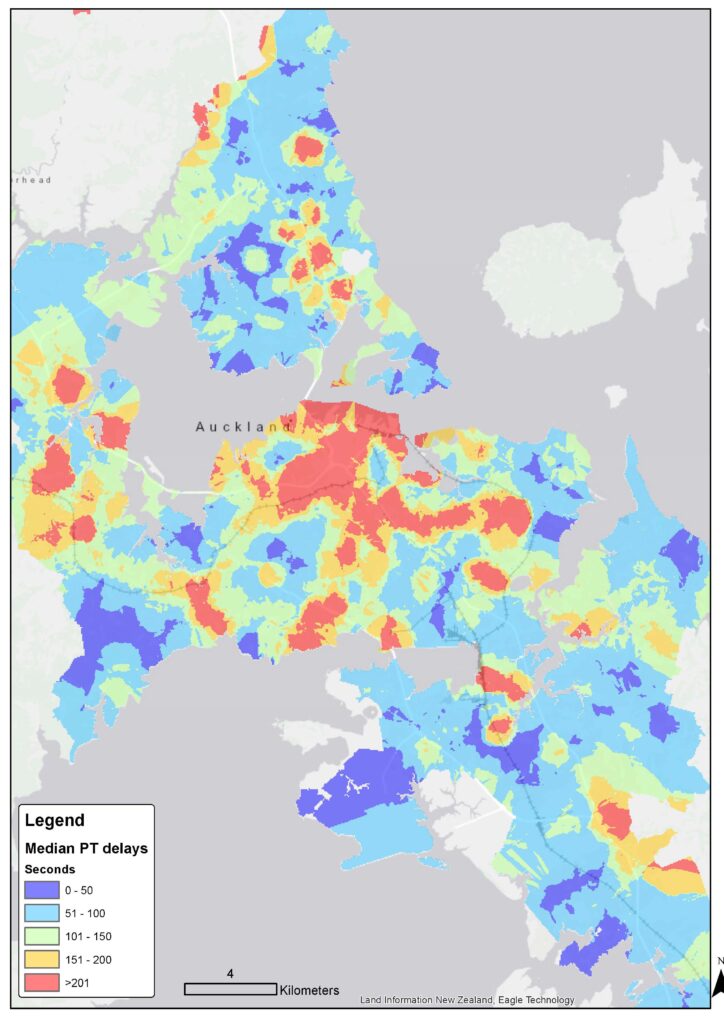
GTFS realtime provides delays for each PT trip on a transport network. While delays are mostly negative (behind the schedule), more than often, there are positive delays (ahead of schedule) in the network. For some reason, there are also services with extreme delays (more than a few hours). When mapping the delays based on PT stops, the median delay was used to avoid biased towards extreme outlier events. Figure 2 shows median the map of the median delay from 6 am to 9 am, Friday 11 Sep 2020.
Reasons for delays
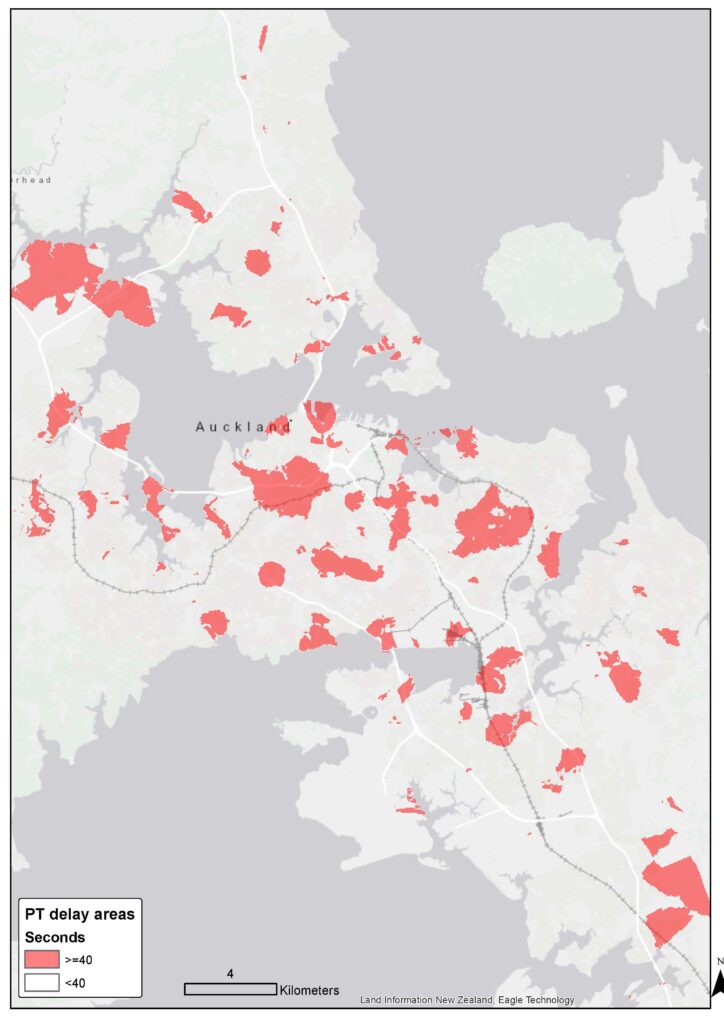
While the median delay shows where people are most affected by unreliable PT services, it does not show much where these delays are coming from. Once a delay happens in any part of the network, it moves along the route to the next stations. To identify only stations that cause the delays, the delays in each station has been isolated. Red areas in Figure 3 shows where causes more than 40 seconds in the network. While the median delay in the CBD is more than 200 seconds, the CBD itself contributes little or nothing to these delays.
Best areas of investments
Identifying the areas that cause a delay in a network is helpful to improve the network. However, it is also useful to know which of these areas are easier to fix than others. While some part of the network requires millions of dollars in bus lanes and bus priority measures, some other areas can be fixed with a small adjustment in the PT schedule.
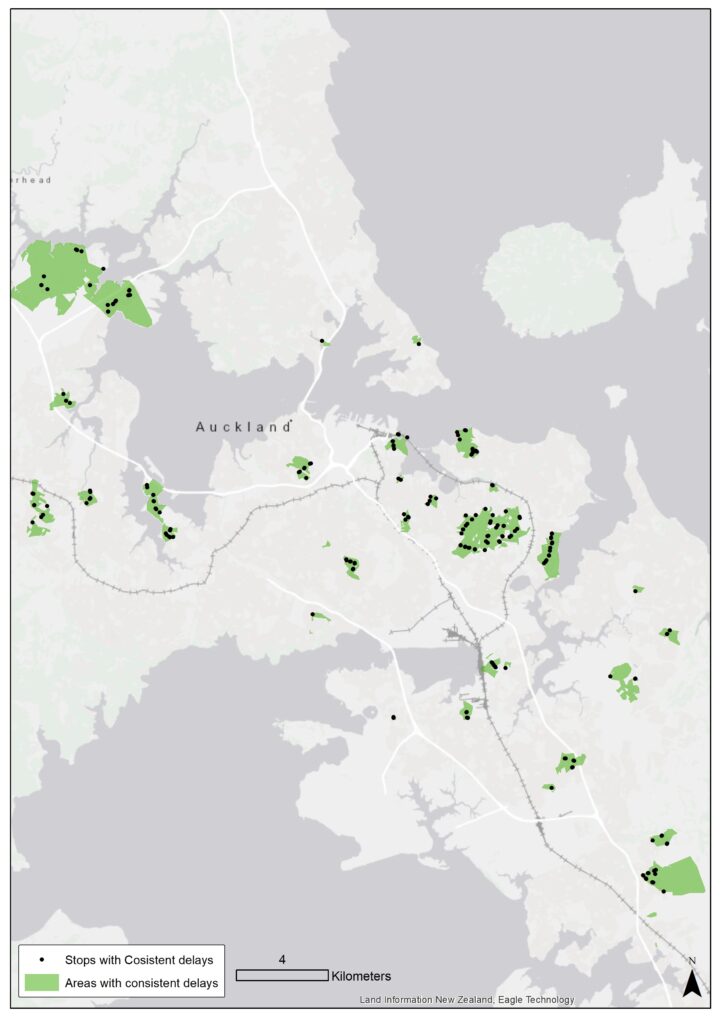
The variability of delays is important to show if the delays are coming from the operating environment or the timetable is simply unachievable in the first place. A consistent delay suggests the timetable should be updated, but a variable delay can point to locations where infrastructure treatments are needed. Figure 4 shows the areas with the highest and most consistent delays in the network. While clusters in East, West and South (such as Te Atatu North and Glen Innes) can be identified in this map, Northshore does not seem to have any clusters.
Conclusion
“Arriving when planned” is one of the most important desires of PT riders. Therefore service reliability is a key performance indicator to make PT attractive enough for people to use it. The studies in this area attract a lot of attention because the results can directly inform policies. In this paper, the areas that cause delays in the network have been identified. While fixing the network can be a costly practice, identifying areas that can be fixed with minimal effort can help transport authorities to improve their network in short term.
This work, however, is not without limitations. The sample data is limited to 6 am to 9 am on Friday morning. More sample data, possibly a week of data, can help to better understand the network. Moreover, the data resolution is limited to 50 sqm. which might be too coarse for some areas.
The code developed for this study is in a draft format. If transport authorities are interested in the code behind the analysis or have some ideas that can be coded, please feel free to reach me via LinkedIn or email (saeid.adli@gmail.com).
Acknowledgement
I am thankful to Barry and Sara for their useful comments and ideas which I used to develop this post.
If you found this article useful or of value, then please do hit the ‘like’ button and share via Twitter, LinkedIn and Facebook. It would be great to hear your thoughts, so please ask questions or add your comments and stories to this post.